The Waffle House Index: What It Is, How FEMA Uses It, and Why It Matters
When a hurricane bears down on the Southeast, disaster responders check more than wind speed and storm surge — some of them check whether the local Waffle House is still open. It sounds like a joke. It isn’t. The Waffle House Index is a real, if unofficial, way that FEMA and emergency managers gauge how badly a storm has hit a community, often faster than official damage reports can confirm it.
What Is the Waffle House Index?
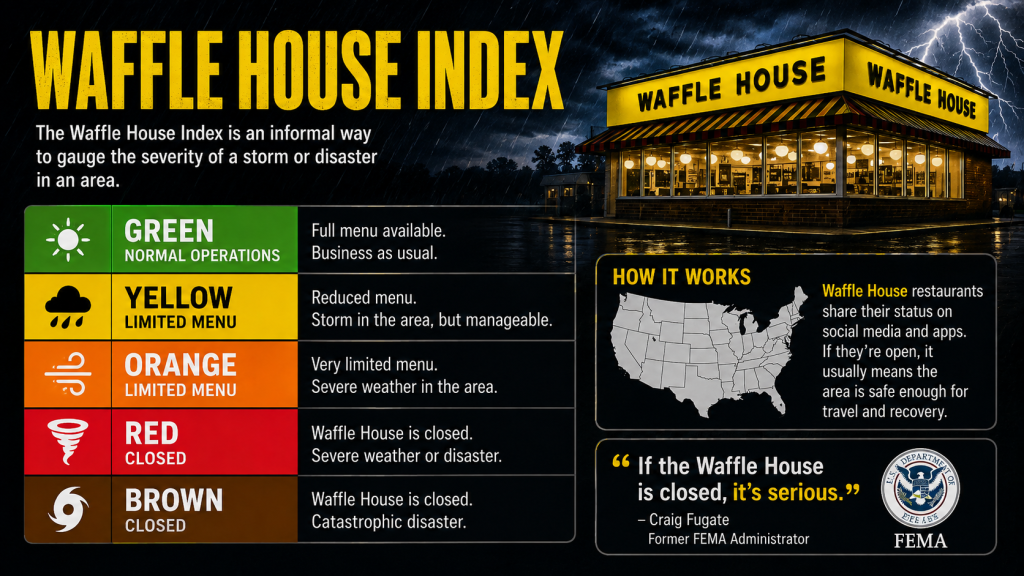
The Waffle House Index is an informal, color-coded system — green, yellow, or red — based on whether a given Waffle House location is open, running a limited menu, or closed after a disaster. Because Waffle House restaurants are famous for staying open through hurricanes, ice storms, and tornadoes, a closed location is treated as a strong signal that an area was hit hard.
It isn’t a government-designed tool. It grew out of a simple observation: Waffle House reopens faster than almost anyone else, so when it doesn’t, something is seriously wrong nearby.
How the Waffle House Index Works
| Status | What it means | What it signals |
|---|---|---|
| 🟢 Green | Full menu, normal operations | Power and supplies are fine; minimal damage nearby |
| 🟡 Yellow | Limited menu, often running on a generator | Power or supply disruption; moderate impact |
| 🔴 Red | Closed | Severe damage or unsafe conditions; rare, and taken seriously when it happens |
As former FEMA Administrator Craig Fugate put it: “If you get there and the Waffle House is closed? That’s really bad. That’s where you go to work.”
Red is rare by design — Waffle House built its whole disaster playbook around avoiding it.
Where the Index Came From
The Index’s origin has two distinct chapters that are often blurred together.
2005 — Hurricane Katrina builds the reputation. Seven Waffle House locations were destroyed and more than 100 shut down. But the restaurants that reopened quickly saw a surge of customers — people with no power, no groceries, and nowhere else hot to eat. Waffle House executives noticed, and built a formal crisis-response playbook: portable generators, a mobile command center, and pre-planned “grill-only” menus for when the power is out but the gas line isn’t.
2011 — Craig Fugate coins the actual term. Following the deadly Joplin, Missouri tornado, then-FEMA Administrator Craig Fugate — who’d spent eight years running Florida’s emergency management before that — started publicly using “the Waffle House Index” to describe what he’d been watching for years. The name stuck, and journalists ran with it.
So: Katrina created the behavior the Index measures; Joplin is where the Index got its name.
Is the Waffle House Index Official FEMA Policy?
Not exactly — and this is where a lot of coverage oversimplifies things. Fact-checkers at Snopes confirmed that FEMA does not formally use Waffle House closures as an official assessment metric. It’s an informal heuristic Fugate personally championed, not a written policy. A 2017 FOIA request even turned up internal FEMA emails describing it as “a personal project” of Fugate’s, explicitly denying a formal tie to FEMA’s National Business Emergency Operations Center.
Waffle House also isn’t the only business FEMA-adjacent officials have informally watched this way — the idea traces back further to a 2011 academic observation about resilient national chains in general, not Waffle House specifically.
None of that makes the Index useless. It means it’s best understood as a genuinely useful rule of thumb that became folklore — not a line item in a federal manual.
Real Examples: The Index in Action
Hurricane Irene (2011). Twenty-two North Carolina, Virginia, Maryland, and Delaware locations lost power. In Weldon, N.C., one Waffle House kept serving by candlelight, then reopened at dawn — boiling water on the gas grill to run the coffee machine before power even came back. Waffle House’s mobile command center, an RV nicknamed “EM-50” after Bill Murray’s vehicle in Stripes, was already en route. One customer, two days without a hot meal, ordered hash browns scattered, covered and smothered like nothing had changed. The emergency grill-only menu that day: ham-and-egg sandwiches for $3.15 — 2011 storm pricing worth comparing to today’s.
Joplin tornado (2011). Both Joplin-area Waffle Houses stayed open through one of the deadliest tornadoes in six decades — the event that gave Fugate his metric’s name.
Hurricane Ian (2022). Waffle House closed 21 Florida locations ahead of landfall — a level of preemptive closure rare enough to make national news on its own.
Hurricane Idalia (2023). Five locations closed across Florida’s Big Bend, including named towns like Live Oak and Madison — specific enough that reporters could map the storm’s expected path just from the closure list.
Hurricane Milton (2024). Waffle House posted its own live #WHIndex status map on X, publicly citing the Index by name as it closed Tampa-area restaurants. The folklore has become an official part of the company’s own crisis communications.
Not Just Hurricanes Anymore
In January 2026, the Index made headlines for something other than a hurricane: a severe winter storm — snow, sleet, and freezing rain — closed Waffle House locations in Tennessee and Georgia. Local news outlets explicitly invoked the “Waffle House Index” to describe how dangerous conditions were, even though it’s historically a hurricane-season term. The Index has quietly outgrown its original use case.
Why It’s Surprisingly Accurate
Waffle House is built for exactly this. Locations keep pre-positioned generators, decentralized supplier contracts, and staff trained on a “limited menu” protocol so a location can serve something even without power. Management can make close/reopen decisions on the spot, without waiting on corporate sign-off — which is why Waffle House often reopens before official damage assessments are even complete.
It’s not just internet folklore, either. In an academic paper, Washington University business professor Panos Kouvelis ranked Waffle House among the top four companies for disaster response — alongside Walmart, Home Depot, and Lowe’s. Sales at reopened locations can double or triple after a storm, driven by people with no power and nowhere else to get a hot meal.
Limitations of the Waffle House Index
- Geography. It only works where Waffle House exists — the Southeast and mid-Atlantic. It’s meaningless for a wildfire in California or a blizzard in Minnesota.
- It’s a signal, not a survey. One closed location tells you about that location, not the whole region — official damage assessments still matter for the full picture.
- Non-disaster closures happen too. Staffing issues, security concerns, or ordinary business reasons can close a location independent of storm severity.
- It’s informal by design. As the Snopes fact-check and 2017 FOIA emails confirm, it was never meant to be a precise instrument — treating a single Red status as hard data risks reading too much into a rule of thumb.
Frequently Asked Questions
Is the Waffle House Index a myth?
Not entirely, but it’s more informal than most coverage suggests. FEMA doesn’t officially use it as policy, but Fugate genuinely relied on it personally, and Waffle House itself now publicly references it during storms — so it sits somewhere between real practice and internet legend.
Does FEMA actually use the Waffle House Index?
Informally, yes — Craig Fugate has said publicly that it helped him gauge disaster severity during his time as FEMA Administrator. But there’s no official FEMA policy document defining it.
What does it mean when the Waffle House Index is red?
Red means the nearest Waffle House is closed — which is rare, since the company’s entire disaster playbook is built around staying open. When it happens, it’s treated as a strong sign of severe local damage.
Is there a live Waffle House Index map?
Independent trackers have built unofficial live maps using National Weather Service alert data to estimate which locations may be at risk — though actual operating status can only be confirmed by contacting a location directly.